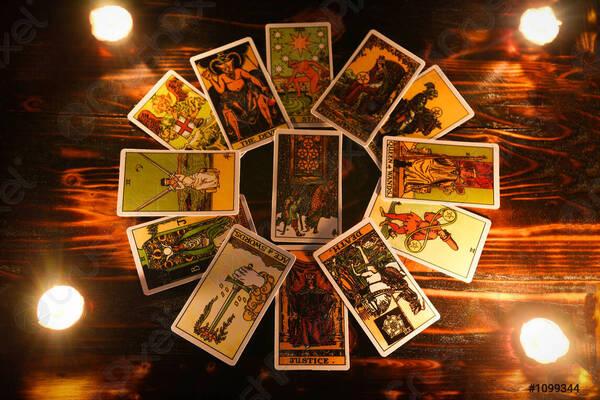
Dowsing chart
There are many types of dowsing charts available for a wide variety of topics. Dowsing can be done without any tools at all, but having a dowsing chart (or two) can help considerably.
The purpose of using a chart when dowsing is to be able to select from a number of possible answers, without having to remember them all yourself! Pendulums are the most usual way of working with dowsing charts, but there is no one tool which is the best. It is only what works best for you which counts!
Charts can be simple or complex and consist of circular lists for remedies, modalities, or supplements or as percentages for calibration or simple numbers to determine quantities. Amongst the most common types seen are those arranged in a circle or semicircle. However, there is very little difference between a chart and a list in some cases. After all, the possible answers to a question could just as easily be listed as put into a more fancy semi-circle. The use is just the same.
From that, you can easily imagine that you can construct your own dowsing charts quite quickly. A pencil and paper is all you need.
To make your chart look neater or more appealing, you can use graphics packages on your computer to lay out the answers in a way you like. For example, you could divide a circle into quarters, and divide each quarter again, placing possible answers into each new division. Or, you could have main subdivisions at each corner of the page and several different small circles of answers near each of them towards the center of the page. It depends on what it is you are dowsing. Really, the only limit is your imagination.
However, always make sure that, no matter how you lay out your chart, there should always be room for the word ‘Other’. It is always the case that you will have missed out or not thought of a possible answer. You should always include the option of ‘something else’ in your chart. Otherwise you could get seriously misled.
![]()


